jemalloc 3.6 版本导致的性能问题
最近我们有一个服务在测试过程中发现了性能问题,最终定位到是因为 jemalloc 使用了 madvise 的 MADV_DONTNEED 导致的,这里分享一下定位过程。
测试环境和问题描述
测试程序通过网络接受 RPC 请求后,执行处理逻辑,程序运行环境如下:
- CentOS 7.6 + kernel 3.10
- 程序运行在 docker 容器内
Benchmark 过程很简单,就是通过客户端程序发起请求,然后看看测试过程能达到的服务带宽有多少。在获得结果后,我们发现,使用 jemalloc 的版本性能下降了差不多 20%(不过我们一开始并不知道是 jemalloc 导致的)。
定位过程
获取 profile 数据,生成火焰图
这里使用 bcc 的 profile 工具来生成 profile stack 文件,然后使用 Brendan Gregg 的 FlameGraph 工具将其转换成火焰图 (https://github.com/brendangregg/FlameGraph)。
Profile 命令如下:
# /usr/share/bcc/tools/profile -F 99 -f -a -p $PID 30 > profile.stack
FlameGraph 命令如下:
$ ./flamegraph.pl profile.stack > profile.svg
得到的火焰图中的关键部分如下:
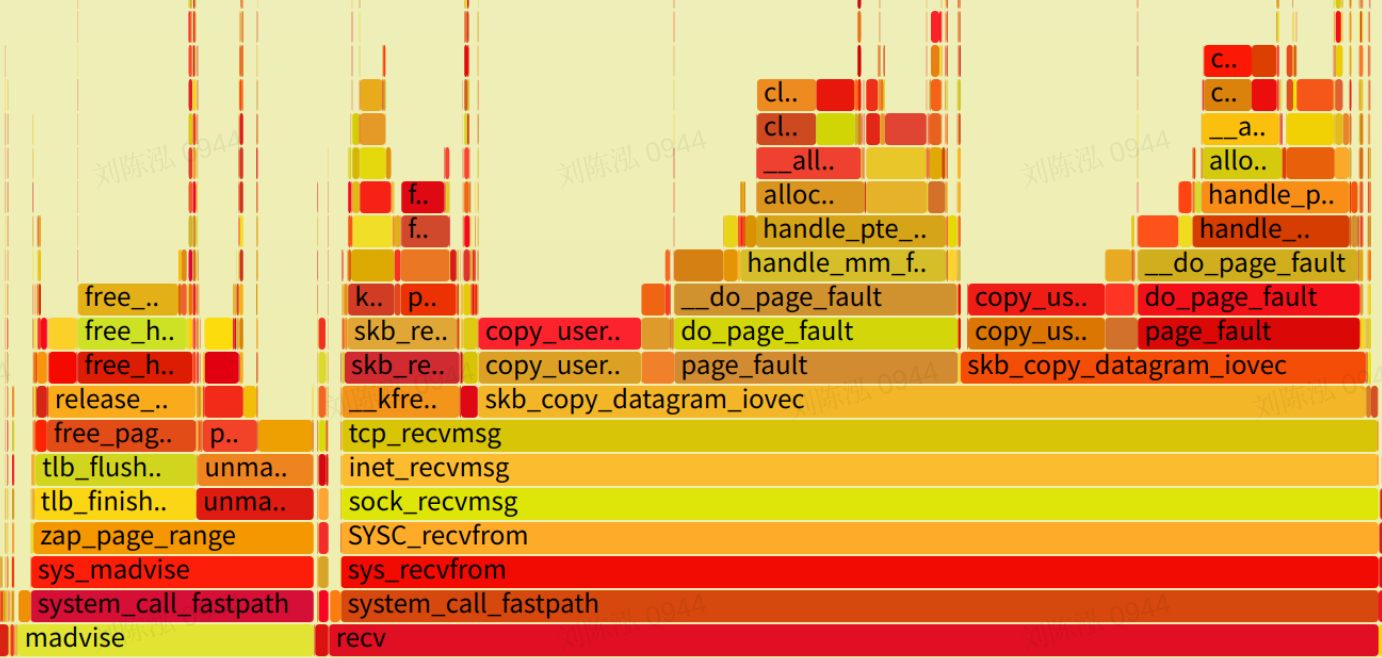
从上图中可以看出两个奇怪的地方:
- 有很多
madvise调用。 - 收包的时候经常伴随着内存申请操作 (page_fault 的处理)。
minor page fault 有多少
因为从火焰图中看到了很多 page fault,所以可以通过其他工具来看一下 page fault 的类型和产生速率。因为我们的系统上是关闭了 swap 的,所以肯定都是 minor page fault,这里主要是要查看一下速率。可以通过 sar 命令来查看:
$ sar -B 1
Linux 3.10.0-957.el7.x86_64 (node)   01/16/2022      _x86_64_        (40 CPU)

11:49:13 AM  pgpgin/s pgpgout/s   fault/s  majflt/s  pgfree/s pgscank/s pgscand/s pgsteal/s    %vmeff
11:49:14 AM      0.00    100.00 608239.00      0.00 869641.00      0.00      0.00      0.00      0.00
11:49:15 AM      0.00   3692.00 737822.00      0.00 971933.00      0.00      0.00      0.00      0.00
11:49:16 AM      0.00    104.00 466154.00      0.00 781245.00      0.00      0.00      0.00      0.00
11:49:17 AM      0.00    124.00 460824.00      0.00 769351.00      0.00      0.00      0.00      0.00
11:49:18 AM      0.00    136.00 510035.00      0.00 806849.00      0.00      0.00      0.00      0.00
可以发现,每秒钟产生了 50w 次以上的 minor page fault。
查看 socket rmem 的使用情况
此外,因为是在收包的过程中发生了内存申请操作,我们还可以使用 sormem.bt 这个 bpftrace 程序 (https://github.com/brendangregg/bpf-perf-tools-book/blob/master/originals/Ch10_Networking/sormem.bt) 来进行查看一下进程的 socket recv buffer 的情况:
$ ./sormem.bt
Attaching 4 probes...
Tracing socket receive buffer size. Hit Ctrl-C to end.
^C

@rmem_alloc:
[0]                15638 |@                                                   |
[1]                    0 |                                                    |
[2, 4)                 0 |                                                    |
[4, 8)                 0 |                                                    |
[8, 16)                0 |                                                    |
[16, 32)               0 |                                                    |
[32, 64)               0 |                                                    |
[64, 128)              0 |                                                    |
[128, 256)             0 |                                                    |
[256, 512)             0 |                                                    |
[512, 1K)            699 |                                                    |
[1K, 2K)            1136 |                                                    |
[2K, 4K)          433243 |@@@@@@@@@@@@@@@@@@@@@@@@@@@@@@@@@@@@@@@@@@@@@@@@@@@@|
[4K, 8K)            7037 |                                                    |
[8K, 16K)           3750 |                                                    |
[16K, 32K)           219 |                                                    |
[32K, 64K)            18 |                                                    |
[64K, 128K)          191 |                                                    |
[128K, 256K)         200 |                                                    |
[256K, 512K)         118 |                                                    |
[512K, 1M)            19 |                                                    |
[1M, 2M)               2 |                                                    |
[2M, 4M)          192207 |@@@@@@@@@@@@@@@@@@@@@@@                             |
[4M, 8M)            8551 |@                                                   |

@rmem_limit:
[128K, 256K)        8580 |                                                    |
[256K, 512K)        6030 |                                                    |
[512K, 1M)             0 |                                                    |
[1M, 2M)           33400 |@@                                                  |
[2M, 4M)            7956 |                                                    |
[4M, 8M)          605235 |@@@@@@@@@@@@@@@@@@@@@@@@@@@@@@@@@@@@@@@@@@@@@@@@@@@@|
[8M, 16M)              0 |                                                    |
[16M, 32M)          1187 |
从 rmem_alloc 的数据可以看出,服务端程序在 benchmark 过程中大量使用了小块的内存。不过,这个数据无法直接推导出一些结论,只能说这可能和内存管理的行为有关。
查看 madvise 调用情况
在查看了 madvise 的 man 手册之后,我发现 madvise 的参数选择对于程序的性能影响很大,所以我们需要知道这里执行的 madvise 调用的参数是什么。这里我写了一个 bpftrace 的程序来获取程序调用 madvise 时使用的参数:
$ cat trace_madvise.bt
#!/usr/bin/bpftrace

BEGIN
{
        printf("trace syscall madvise of pid %d\n", $1);
}

t:syscalls:sys_enter_madvise /pid == $1/
{
        printf("pid %d, comm %s, arg1 %lx, arg2 %ld, arg3 %ld\n", pid, comm, args->start, args->len_in, args->behavior);
}

t:syscalls:sys_exit_madvise /pid == $1/
{
        printf("pid %d, comm %s, retval %d\n", pid, comm, args->ret);
}
在 benchmark 的过程中执行这个脚本,得到的结果主要内容如下:
pid 336963, comm cmdname, arg1 7fcd81dab000, arg2 1048576, arg3 4
pid 336963, comm cmdname, retval 0
arg3 4 表示 madvise 的 advice 参数,这里 4 对应的是 MADV_DONTNEED。另外,我还统计了一下 benchmark 过程中 madvise 调用的数量,达到了 22w 次。
MADV_DONTNEED 这个坑
这个参数的行为很诡异,会直接导致 Linux 立刻回收内存,然后再次访问这块内存,会触发一个内存分配操作,它的行为基本上等于 free 了。man 手册中的关键内容如下:
After a successful MADV_DONTNEED operation, the semantics of memory access in the specified region are changed: subsequent accesses of pages in the range will succeed, but will result in either repopulating the memory contents from the up-to-date contents of the underlying mapped file (for shared file mappings, shared anonymous mappings, and shmem-based techniques such as System V shared memory segments) or zero-fill-on-demand pages for anonymous private mappings.
所以我去搜下了下:
- jemalloc purge改进
- 深入理解 Linux 内核–jemalloc 引起的 TLB shootdown 及优化
- 这里要提一下,我们的这个问题并没有 TLB shotdown。
- madivse MADV_DONTNEED causes bad performence in KVM virtual machine
下面这个视频我更是强烈推荐,吐嘈之余,让你也能理解这个参数的历史: https://www.youtube.com/watch?v=bg6-LVCHmGM&t=3518s
问题总结
了解了程序的行为以及 madvise 这个坑之后,我们就可以得到这个性能问题的结论了: 由于程序使用的 jemalloc 3.6 版本在运行过程中,大量调用 madvise(MADV_DONTNEED),导致内存不断被 kernel 回收。因此,在收包的过程中只好又去申请新的内存,导致收包的性能下降。
关闭 jemalloc 内存回收进行问题确认
可以通过如下的环境变量关闭 jemalloc 的内存回收机制,
export MALLOC_CONF="lg_dirty_mult:-1"
这个参数在 jemalloc 的如下代码路径上发挥作用:
// 在 src/arena.c 中找到如下函数
static inline void
arena_maybe_purge(arena_t *arena)
{
        size_t npurgeable, threshold;

        /* Don't purge if the option is disabled. */
        if (opt_lg_dirty_mult < 0)
                return;
关闭内存回收之后,我们的程序就不再出现上述的性能问题。
Kernel 4.18 的对比测试
随后,我在 CentOS 7.6 + kernel 4.18 的环境上也进行了 benchmark,发现在 kernel 4.18 上,程序的性能下降比较少,大概是 10%。随后写了一个 trace_tcp_recvmsg_time.bt 的 bpttrace 程序,对比了一下两个版本的 kernel 在 tcp_recvmsg 函数上的性能差异。
程序如下:
[root@node tools]# cat calc_tcp_recvmsg_time.bt
#!/usr/bin/bpftrace

BEGIN
{
        printf("Calc tcp_recvmsg time of pid %d\n", $1);
}

kprobe:tcp_recvmsg /pid == $1/
{
        @start[tid] = nsecs;
}

kretprobe:tcp_recvmsg /pid == $1/
{
        if (@start[tid]) {
                @pf_nsecs = hist((nsecs - @start[tid]) / 1000);
                delete(@start[tid]);
        }
}

END
{
        print(@pf_nsecs);
        clear(@start);
        clear(@pf_nsecs);
}
Kernel 3.10 的结果:
Attaching 4 probes...
Calc tcp_recvmsg time of pid 366959
^C@pf_nsecs:
[1]                  327 |                                                    |
[2, 4)             53761 |@@@@@@@@@@@@@@@@@@@@@@@@@@@@@@                      |
[4, 8)              7840 |@@@@                                                |
[8, 16)            39434 |@@@@@@@@@@@@@@@@@@@@@@                              |
[16, 32)            1685 |                                                    |
[32, 64)             223 |                                                    |
[64, 128)            229 |                                                    |
[128, 256)           126 |                                                    |
[256, 512)             9 |                                                    |
[512, 1K)          10484 |@@@@@                                               |
[1K, 2K)           92465 |@@@@@@@@@@@@@@@@@@@@@@@@@@@@@@@@@@@@@@@@@@@@@@@@@@@@|
[2K, 4K)               9 |                                                    |
[4K, 8K)               0 |                                                    |
[8K, 16K)              0 |                                                    |
Kernel 4.18 的结果:
Attaching 4 probes...
Calc tcp_recvmsg time of pid 20607
^C@pf_nsecs:
[0]                   23 |                                                    |
[1]                  274 |                                                    |
[2, 4)             32551 |@@@@@@@@@@@@@@@@                                    |
[4, 8)             52765 |@@@@@@@@@@@@@@@@@@@@@@@@@@                          |
[8, 16)            35111 |@@@@@@@@@@@@@@@@@                                   |
[16, 32)            1375 |                                                    |
[32, 64)             116 |                                                    |
[64, 128)             41 |                                                    |
[128, 256)            15 |                                                    |
[256, 512)            27 |                                                    |
[512, 1K)         103847 |@@@@@@@@@@@@@@@@@@@@@@@@@@@@@@@@@@@@@@@@@@@@@@@@@@@@|
[1K, 2K)           17881 |@@@@@@@@                                            |
[2K, 4K)               2 |                                                    |
得到的结论是,kernel 4.18 在这个路径上的性能确实比 kernel 3.10 更好。不过,因为不能对 kernel 的 do_page_fault 函数进行 kprobe,所以不确定这里的性能改进是哪部分贡献的。
 本作品采用知识共享署名-非商业性使用-禁止演绎 4.0 国际许可协议进行许可。