如何使用 top 命令
top 命令是 Linux 下最常用的系统监控命令。默认执行 top 命令之后,我们就能看到系统的许多监控指标,也可以看到进程按照 CPU 利用率从高到低排列。但是,这个只是 top 命令的最简单用法,其实 top 可以进行很多的定制。
The top command is the most commonly used system monitoring command under Linux. After executing the top command by default, we can see many monitoring indicators of the system, and we can also see that the processes are arranged in order of CPU utilization from high to low. However, this is just the simplest usage of the top command. In fact, top can be customized a lot.
top 界面模式 top Display Modes
top 的界面其实有两个模式:full-screen mode 和 alternate-display mode,根据实际的效果来看,这两个模式就是全屏模式和多窗口模式。不做任何定制的时候,我们看到的就是全屏模式。如下图所示:
The top interface actually has two modes: full-screen mode and alternate-display mode. According to the actual effect, these two modes are full-screen mode and multi-window mode. Without any customization, we see full-screen mode by default. As shown below:
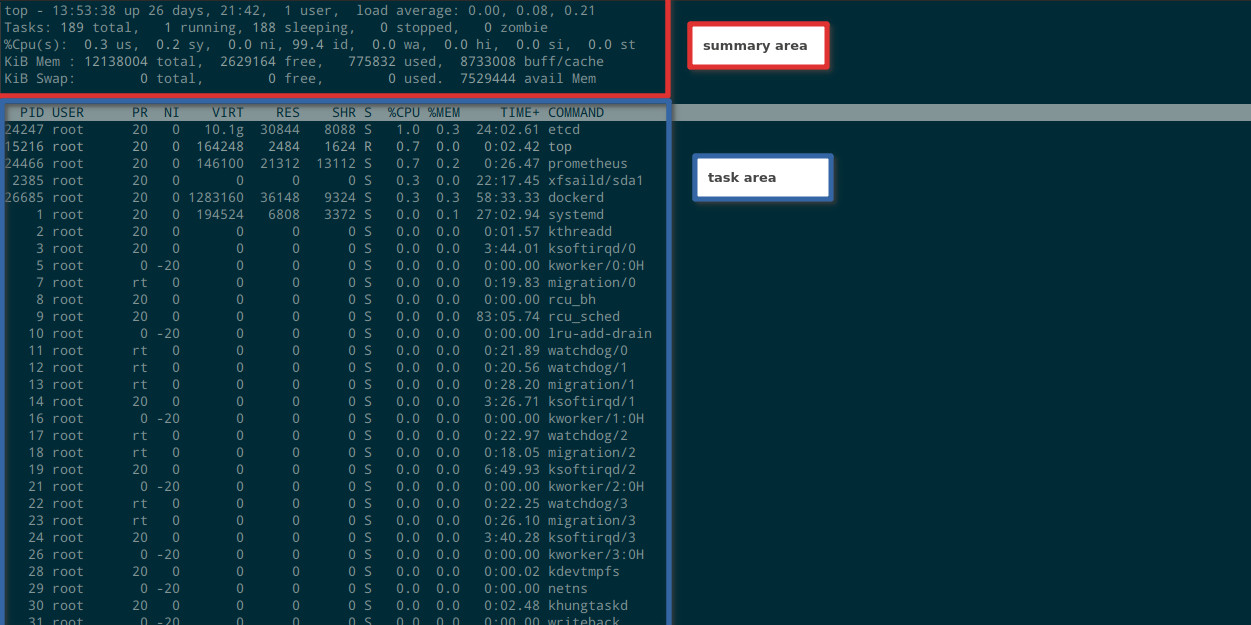
full-screen mode
全屏模式时,整个界面分为两个部分:summary area 和 tasks area,如上图所示。
In full screen mode, the entire interface is divided into two parts: summary area and tasks area, as shown in the figure above.
alternate-display mode
多窗口模式的界面如下:
The interface of multi-window mode is as follows:
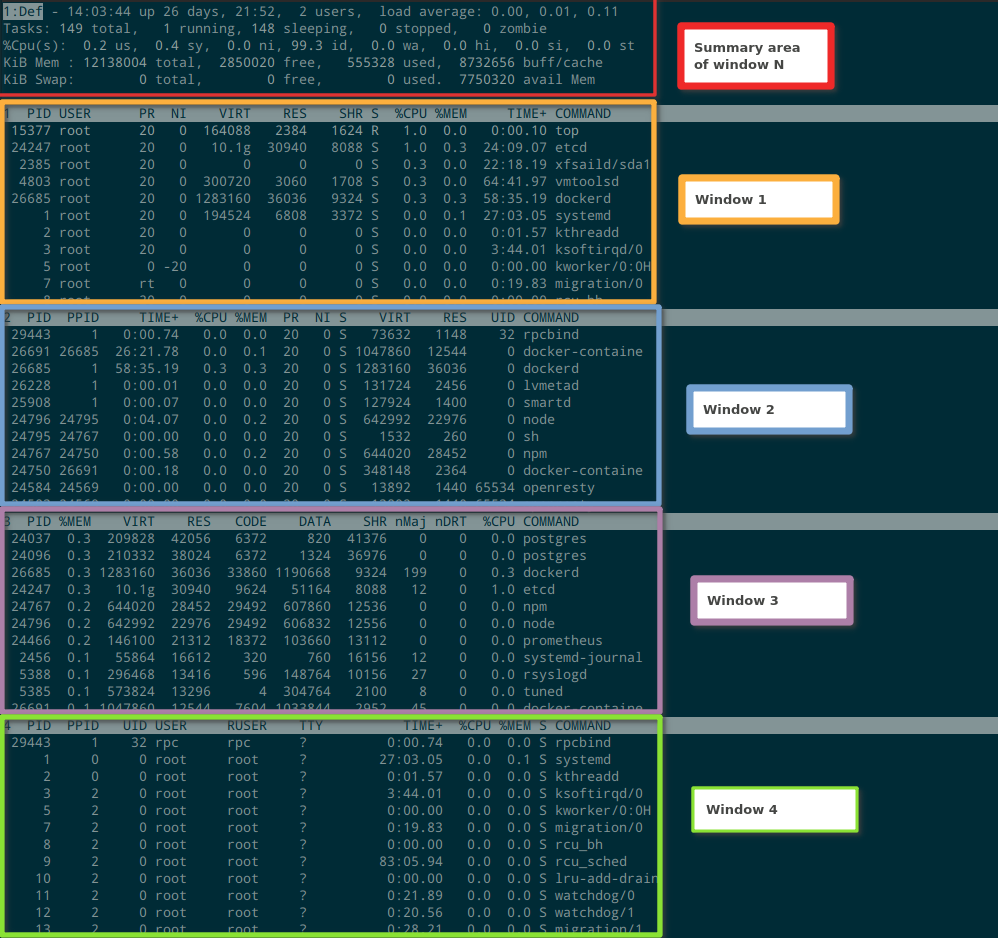
要进入多窗口模式,在全屏模式下,按 A 即可(这个可以在两个模式间来回切换)。多窗口模式有一个 summary area 和 4 个 window,4 个窗口从上到下编号,对应 1 到 4。summary area 默认为 window 1 的 summary area,可以切换为不同 window 的 summary area,这个可以从 summary area 左上角的提示看出来。这个提示区会展示 summary area 当前对应的 window 的编号和名字,比如 1:Def。要切换 summary area 对应不同的 window,可以按 a (从上到下) 或者 w (从下到上)。
To enter multi-window mode, press A in full screen mode (this can switche between the two modes). The multi-window mode has a summary area and 4 windows. The 4 windows are numbered from top to bottom, corresponding to 1 to 4. The summary area defaults to the summary area of window 1, and can be switched to the summary area of other windows. This can be seen from the prompt in the upper left corner of the summary area. This prompt area will display the number and name of the window currently corresponding to the summary area, such as 1:Def. To switch the summary area corresponding to different windows, you can press a (from top to bottom) or w (from bottom to top).
top 默认定义了 4 个 window,这里先给出名字和编号,其他的下文再详述:
top defines 4 windows by default, the names and numbers are given here first, and the rest will be detailed below:
- Def
- Job
- Mem
- Usr
Field Group
top 其实有两个概念是混合使用的,就是 window 和 Field Group,你可以认为他们就是等价的,本文除了这一小节,后面都使用 window 这个术语。。上面提到了,top 默认定义了 4 个 window,每个 window 配置要显示的列,就称为这个 window 的 Field Group。在全屏模式下,可以通过快捷键 g 切换当前要显示的 Field Group 是哪个,使用序号 1 到 4 到进行选择。修改当前展示的 Field Group 不仅是改变要显示的内容,也会使用对应的 window 的样式,包括过滤器和颜色配置等。
In fact, there are two concepts in top used alternatively, namely window and Field Group. You can simply take them as equivalent. Except for this section, the term window is used in the rest of this article.. As mentioned above, top defines 4 windows by default, and the column to be displayed in each window configuration is called the Field Group of this window. In the full screen mode, you can switch which Field Group is currently displayed by the shortcut key g , and use the serial number 1 to 4 to select. Modifying the currently displayed Field Group not only modifies the content to be displayed, but also the style configuration of the window, including filters and color configurations.
在多窗口模式下,快捷键 g 就对应到切换 window,效果和 a w 是一样的。在多窗口模式下,快捷键 G 用来修改 window 的名字。
In multi-window mode, the shortcut key g corresponds to switching windows, and the effect is the same as a and w. In multi-window mode, the shortcut key G is used to modify the name of the window.
界面的滚动和定位 Scrolling and Positioning on the Interface
在任何一个 window 下,或者全屏模式下,top 都支持如下快捷键来进行界面的滚动:
In any window or full screen mode, top supports the following shortcut keys to scroll the interface:
- Up or alt+k
- Down or alt+j
- Left
- Right
- PgUp
- PgDown
- Home
- End
上面这些和大多数应用是一样的,就不展开说了。这里要说的是,top 支持显示一个定位信息,你可以看到自己现在处于第几行,第几个字段,通过快捷键 C 切换:
The above are the same as most applications, so I won’t expand on that. What I want to say here is that top supports displaying a positioning information, you can see which row and field you are in now, you can switch by shortcut key C:
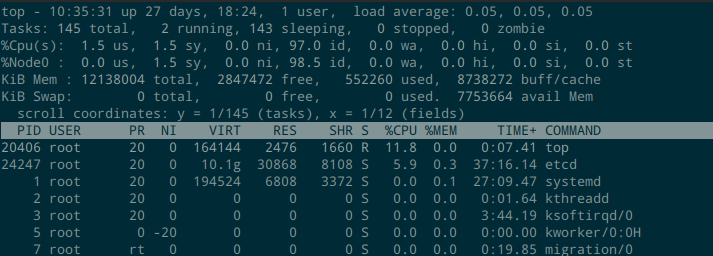
这个定位信息,也很容易看,y 表示当前的第一行是第几个 task 以及一共有几个 task;x 表示当前的第一列是第几列,以及一共有多少列。
This positioning information is also easy to understand. y indicates the task number of current first row and how many tasks there are in total; x indicates the column number of current first column and how many columns are there in total.
scroll coordinates: y = 1/145 (tasks), x = 1/12 (fields)
Summary Area
Summary area 展示了系统的全局监控信息,如下所示。整个区域从上到下分为 3 个部分: load average, tasks and cpu, memory。
The Summary area displays the global monitoring information of the system, as shown below. The whole area is divided into 3 parts from top to bottom: load average, tasks and cpu, memory.
top - 14:24:54 up 26 days, 22:13,  1 user,  load average: 0.08, 0.05, 0.05        # load average
Tasks: 145 total,   1 running, 144 sleeping,   0 stopped,   0 zombie              # tasks and cpu
%Cpu(s):  0.2 us,  0.2 sy,  0.0 ni, 99.5 id,  0.0 wa,  0.0 hi,  0.0 si,  0.0 st   # tasks and cpu
KiB Mem : 12138004 total,  2857072 free,   548312 used,  8732620 buff/cache       # memory
KiB Swap:        0 total,        0 free,        0 used.  7757480 avail Mem        # memory
Load average
Load average 部分主要展示系统的负载。
The load average part mainly displays the load of the system.
#     Now      Uptime              User     Load average
#                                  count                  1m    5m    15m
top - 14:24:54 up 26 days, 22:13,  1 user,  load average: 0.08, 0.05, 0.05
如下快捷键可以用来控制这个区域:
The following shortcut keys can be used to control this area:
- l(lower case L): 切换是否显示。Switch whether to display.
Tasks and CPU
Tasks 部分主要展示系统的进程数或者线程数(根据 threads-mode 来决定)。
The Tasks section mainly displays the number of processes or threads of the system (determined according to threads-mode).
#      Total        State      State           State        State
#      tasks or     running    sleeping        stopped      zombie
#      threads
Tasks: 145 total,   1 running, 144 sleeping,   0 stopped,   0 zombie
CPU 的部分主要是展示不同状态的任务的 CPU 消耗占比:
The CPU part mainly shows the CPU consumption ratio of tasks in different states:
%Cpu(s): 0.2 us, 0.2 sy, 0.0 ni, 99.5 id, 0.0 wa, 0.0 hi, 0.0 si, 0.0 st
具体的缩写含义如下:
The abbreviations explanations:
- us: user, time running un-niced user processes, 普通进程的 CPU 消耗占比。The percentage of CPU consumption of ordinary processes.
- sy: system, time running kernel processes, 内核任务的 CPU 消耗占比。The proportion of CPU consumption of kernel tasks
- ni: nice, time running niced user processes, 高优先级进程的 CPU 消耗占比。The percentage of CPU consumption of high-priority processes.
- id: idle, time spent in the kernel idle handler, 空闲时间占比。The percentage of idle time.
- wa: IO-wait, time waiting for I/O completion, 等待 IO 完成的 CPU 消耗占比(进程处于 D 状态)。The percentage of CPU consumption waiting for IO completion (process is in D state).
- hi: time spent servicing hardware interrupts, 用于处理硬中断的 CPU 消耗占比。The percentage of CPU consumption used to handle hard interrupts.
- si: time spent servicing software interrupts, 用于处理软中断的 CPU 消耗占比。The percentage of CPU consumption used to handle soft interrupts.
- st: time stolen from this vm by the hypervisor, 虚拟机管理进程从这个虚拟机偷走的 CPU 资源。The CPU resources stolen from this virtual machine by the virtual machine management process.
如下快捷键可以用来控制这个区域:
The following shortcut keys can be used to control this area:
- t: 切换 CPU 部分的展示方式,例如数值还是进度条,也可以切换到关闭这个区域。Switch the display mode of the CPU part, such as the value or the progress bar, and you can also switch to close this area.
- 1(digit one): 切换单个 CPU 和总体 CPU 的显示。Switch the display of single CPU and overall CPU.
- 2: 按照 NUMA Node 展示。Display according to NUMA Node.
- 3: 展示指定 NUMA Node 下的所有 CPU。Show all CPUs under the specified NUMA Node.
- H: 显示线程显示,默认是进程。Using thread display, the default is process.
Memory
Memory 的部分展示了系统的内存信息和交换分区的信息。
The Memory part shows the system’s memory information and swap partition information.
KiB Mem : 12138004 total,  2857072 free,   548312 used,  8732620 buff/cache
KiB Swap:        0 total,        0 free,        0 used.  7757480 avail Mem
- total: 总内存大小。Total memory size.
- free: 空闲内存大小。The size of free memory.
- used: 已使用内存大小。Used memory size.
- buff/cache: block buffer + page cache 所占用的内存大小。The memory size occupied by block buffer + page cache.
- avail Mem: 这个值是系统的估算值,表示可用于启动新程序的物理内存大小(不包括 swap 空间)。This value is the estimated value of the system, indicating the physical memory size (excluding swap space) that can be used to start new programs.
如下快捷键可以用来控制这个区域:
The following shortcut keys can be used to control this area:
- m: 切换 memory 部分的展示方式,例如数值还是进度条,也可以切换到关闭这个区域。Switch the display mode of the memory part, such as the value or the progress bar, and you can also switch to close this area.
- E: 切换内存单位。Switch the memory unit.
Tasks Area
Tasks area 包含两个部分:字段名称和任务列表(根据指定的字段排序)。这里我们先介绍全屏模式下 tasks area,多窗口模式的 tasks area 后面介绍。。对于 tasks area,最主要考虑的是如下几个问题:
The Tasks area contains two parts: the field name and the task list (sorted according to the specified field). Here we first introduce the tasks area in full-screen mode, and the tasks area in multi-window mode will be introduced later. For the tasks area, the main considerations are the following issues:
- 要显示哪些字段?要根据哪个字段排序?升序还是降序?Which fields do you want to display? Which field do you want to sort by? Ascending or descending?
- 是否只展示符合某些条件的任务?Do you only show tasks that meet certain conditions?
要展示哪些字段?要根据哪个字段排序?Which fields do you want to display? Which field do you want to sort by?
top 其实可以展示很多内容,我们可以定义要展示哪些字段。在全屏模式下,按 F 进入字段管理界面,如下:
top can actually display a lot of content, we can define which fields to display. In full screen mode, press F to enter the field management interface, as follows:
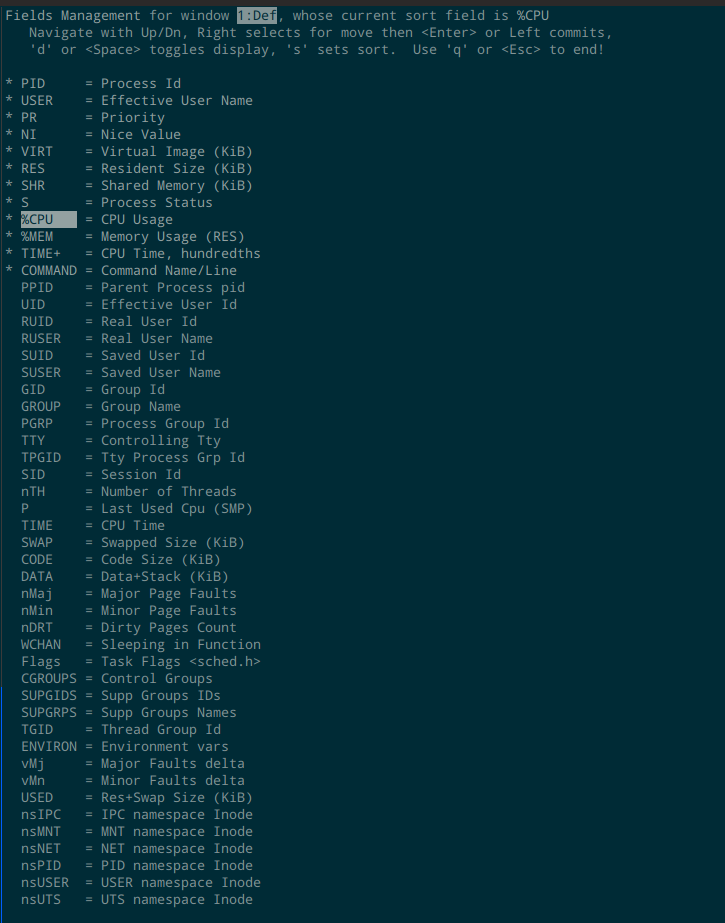
首先要注意的是第一行,这个界面可以为 4 个 window 分别设置要展示的字段,最上面一行提示当前正在为哪个 window 设置字段,以及当前使用的排序字段是哪个。同样的,可以通过可以按 a 或者 w 来切换 window。然后可以上下移动到想要处理的字段,按空格或者 d 切换是否展示,按 s 设置用该字段进行排序,按 q 或者 ESC 退出这个界面。前面的星号表示选中。要调整字段的排列顺序,先选中一个字段,按右键表示开始移动,然后上下移动,然后按左键表示移动结束。
The first thing to note is the first line. This interface can set the fields to be displayed for the 4 windows. The top line prompts which window is currently being set and which sort field is currently used. Similarly, you can switch windows by pressing a or w . Then you can move up and down to the field you want to process, press space or d to switch whether to display, press s to set the field to sort, and press q or ESC to exit this interface. The leading star symbol indicates that it is selected. To adjust the order of the fields, first select a field, press the right arrow key to start moving, then move up and down, and then press the left arrow key to end the move.
下面来看下可用的字段。
Let’s take a look at the available fields.
进程身份相关Process Identity Related
- COMMAND: Command Name/Line
- PID: Process Id
- ENVIRON: Environment vars
- USER: Effective User Name
- PPID: Parent Process pid
- UID: Effective User Id
- RUID: Real User Id
- RUSER: Real User Name
- SUID: Saved User Id
- SUSER: Saved User Name
- GID: Group Id
- GROUP: Group Name
- PGRP: Process Group Id
- TTY: Controlling Tty
- TPGID: Tty Process Grp Id
- SID: Session Id
- SUPGIDS: Supp Groups IDs
- SUPGRPS: Supp Groups Names
- TGID: Thread Group Id
如下快捷键可以用来控制这些字段:
The following shortcut keys can be used to control these fields:
- c: 用于切换 COMMAND 列的内容是 command line 还是 program name。Used to switch the content of the COMMAND column is the command line or the program name.
进程状态相关Process State Related
- S: Process Status
- %CPU: CPU Usage
- nTH: Number of Threads
- P: Last Used Cpu (SMP)
- TIME: CPU Time。任务从启动到现在使用的 CPU 时间。The CPU time used by the task since it was started.
- TIME+: CPU Time, hundredths。任务从启动到现在使用的 CPU 时间,精确到百分之一秒。The CPU time used by the task from the start to the present, accurate to one hundredth of a second.
- WCHAN: Sleeping in Function。对于 sleeping 的进程,当前所处的内核函数。Sleeping in Function. For the sleeping process, the current kernel function.
- Flags: Task Flags
进程状态有如下几种:
The process status is as follows:
- D Uninterruptible sleep。不可中断休眠,就是等待 I/O 完成时的状态,会导致 CPU 统计的 wa 上升。Uninterruptible sleep is the state when waiting for the completion of I/O, which will cause the wa of CPU statistics to rise.
- R Running
- S Sleeping
- T Stopped by job control signal
- t Stopped by debugger during trace
- Z zombie
如下快捷键可以用来控制这些字段:
The following shortcut keys can be used to control these fields:
- I (upper case i): 切换 %CPU 的模式,Irix/Solaris 两个模式。Irix mode 的计算方式是跑满一个 CPU 为 100%,%CPU 可能会超过 100%。Solaris mode 则是会把总体利用率除以 CPU 核数,保证不会超过 100%。Switch %CPU mode, there are two modes Irix/Solaris. The calculation method of Irix mode is to run a full CPU as 100%, and %CPU may exceed 100%. Solaris mode will divide the overall utilization by the number of CPU cores to ensure that it will not exceed 100%.
- S: Cumulative time,off 展示两次刷新时间的即时值,而不是从进程启动到现在的累加值。When set to off, displays the instantaneous value of the two refresh times, rather than the cumulative value from the start of the process to the present.
进程优先级相关 Process Priority Related
- NI: Nice Value. 进程的优先级。这个是表示进程的用户态优先级,范围是 -20 到 +19,默认值是 0,值越低优先级越高。The priority of the process. This is the user mode priority of the process, the range is -20 to +19, the default value is 0, the lower the value, the higher the priority.
- PR: Priority. 进程的调度优先级,这个是内核实际使用的任务的优先级,范围是 0 到 39,映射到内核的值是 100 到 139;也可以是 rt ,表示实时任务。内核表示一个 task 的优先级的范围是 0 到 139。其中,0 到 99 是实时进程的优先级,100 到 139 是非实时进程的优先级。PR 的默认值是 20,对应到内核是 120,和 NI 的关系是: PR = 20 + NI。The scheduling priority of the process. This is the priority of the task actually used by the kernel. The range is 0 to 39. The value mapped to the kernel is 100 to 139; it can also be rt, which represents a real-time task. The kernel indicates that the priority of a task ranges from 0 to 139. Among them, 0 to 99 are the priorities of real-time processes, and 100 to 139 are the priorities of non-real-time processes. The default value of PR is 20, corresponding to the core is 120, and the relationship with NI is: PR = 20 + NI.
内存相关 Memory Related
- %MEM: Memory Usage (RES)
- VIRT: Virtual Image (KiB)。表示一个任务使用的虚拟内存总和,包括所有的代码段、数据段、链接的共享库、已经被 swap 的页和已经被映射但是没有使用的页。 Represents the total virtual memory used by a task, including all code segments, data segments, linked shared libraries, pages that have been swapped, and pages that have been mapped but not used.
- RES: Resident Size (KiB)。表示一个任务使用的没有被 swap 的物理内存。 Indicates the physical memory used by a task that has not been swapped.
- SHR: Shared Memory (KiB)。表示一个任务可能和其他任务共享的内存。 Represents the memory that a task may share with other tasks.
- SWAP: Swapped Size (KiB)。表示一个任务的非驻留内存,也就是使用的交换空间。 Represents the non-resident memory of a task, that is, the swap space used.
- CODE: Code Size (KiB)。表示任务的代码段的大小。 Indicates the size of the code segment of the task.
- DATA: Data+Stack (KiB)。Data Resident Set size,包括了程序数据段和栈。 Data Resident Set size, including program data segment and stack.
- USED: Res+Swap Size (KiB)。就是 RES + SWAP。 It is RES + SWAP.
- nDRT: Dirty Pages Count。该 task 内存空间中的脏页的数量。The number of dirty pages in the task memory space.
- nMaj: Major Page Faults。该 task 遇到的 Major Page Faults 的数量。Major Page Fault 是指需要访问通过访问 swap 分区或者硬盘(mmap 一个文件,但是还没把内容读取到内存时)来处理的缺页异常。The number of Major Page Faults encountered by this task. Major Page Fault refers to the page fault exception that needs to be accessed by accessing the swap partition or the hard disk (when mmap is a file, but the content has not been read into the memory).
- nMin: Minor Page Faults。该 task 遇到的 Minor Page Faults 的数量。Minor Page Fault 是指不需要通过访问 swap 分区或者硬盘来处理的缺页异常,简单的说,没用到磁盘 I/O。 The number of Minor Page Faults encountered by this task. Minor Page Fault refers to a page fault exception that does not need to be processed by accessing the swap partition or hard disk. Simply put, disk I/O is not used.
- vMj: Major Faults delta。上次 top 刷新数据以来的 Major Page Faults 增加数量。The number of Major Page Faults increased since the last top refresh.
- vMn: Minor Faults delta。上次 top 刷新数据以来的 Minor Page Faults 增加数量。The number of Minor Page Faults increased since the last top refresh.
如下快捷键可以用来控制这些字段:
The following shortcut keys can be used to control these fields:
- e: 切换内存单位。Switch the memory unit.
CGroup 相关 CGroup Related
- CGROUPS: Control Groups
- nsIPC: IPC namespace Inode
- nsMNT: MNT namespace Inode
- nsNET: NET namespace Inode
- nsPID: PID namespace Inode
- nsUSER: USER namespace Inode
- nsUTS: UTS namespace Inode
是否只展示符合某些条件的任务? Do you only show tasks that meet certain conditions?
这个问题,也就是如何过滤,只展示某些任务。也许你用过 htop,知道 htop 可以和方便的根据名称来过滤。top 其实也可以,而且可以根据很多字段来过滤。
This question, that is, how to filter, only show certain tasks. Maybe you have used htop and know that htop can and conveniently filter by name. In fact, top is also possible, and it can be filtered according to many fields.
只展示非空闲的任务 Show only non-idle tasks
快捷键 i 用来切换是否只展示非空闲任务。
The shortcut key i is used to switch whether to display only non-idle tasks.
限制展示任务的数量 Limit the number of display tasks
快捷键 n 用于限制要展示的任务的数量,0 表示无限制。默认是全部展示(超过一页需要翻页)。
The shortcut key n is used to limit the number of tasks to be displayed, and 0 means unlimited. The default is to display all (more than one page needs to be turned).
只展示指定用户的任务 Only show the tasks of the specified user
快捷键 u 表示要过滤的用户,可以加 ! 前缀表示反向条件。可以输入 UID 或者 username,直接回车表示取消这个过滤条件。
The shortcut key u indicates the user to be filtered, and you can add a ! Prefix to indicate the reverse condition. You can enter UID or username and press Enter to cancel this filter condition.
根据其他条件过滤 Filter by other criteria
top 提供了 Other Filter 的功能,通过快捷键 o (大小写不敏感) 或者 O (大小写敏感) 来启用。过滤条件的格式如下:
top provides the function of Other Filter, which is enabled by the shortcut key o (case insensitive) or O (case sensitive). The format of the filter condition is as follows:
{!}Field-Name?include-if-value
              exclude-if-value
- ! 表示非,不是必选字段,其他都是必填字段。
- Field-Name 表示字段名字,前文已经列出。注意,这里是大小写敏感的,要完全一致。
- ? 代表一个要求的分隔符和操作符(=, <, >):
- < 或者 > 表示字符串比较,或者数值比较。注意比较时的数字的单位问题,100.0m 会比 1.0g 大,所以需要先进行单位切换(例如内存的单位切换,e)
- = 表示部分匹配
- ! Means not, it is not a required field, the others are all required fields.
- Field-Name represents the name of the field, which has been listed above. Note that this is case sensitive and must be exactly the same.
- ? Represents a required separator and operator (=, <, >):
- < or > means string comparison or numerical comparison. Pay attention to the problem of the unit of the number when comparing, 100.0m will be larger than 1.0g, so you need to switch the unit first (for example, the unit of the memory, e)
- = Indicates partial match
可以使用多个条件进行过滤,每个按一次 o 或者 O 输入一个条件,所有条件会进行与操作。可以按 Ctrl-o 显示所有条件。
You can use multiple conditions to filter, each press o or O once to enter a condition, and all conditions will be ANDed. You can press Ctrl-o to display all conditions.
还有两个清理操作:
There are also two cleanup operations:
- = reset filtering in current window
- + reset filtering in all windows
举些例子:
- 过滤 nice 值小于 0 的任务,即以减号开头的 nice 值:
NI=-。 - 过滤所有 postgres 进程:
COMMAND=postgres。
Give some examples:
- Filter nice value less than 0, i.e., beginning with a leading minus:
NI=-. - Filter all postgres processes:
COMMAND=postgres.
搜索 Searching
搜索和过滤不一样,搜索不考虑字段,会在 tasks area 显示的所有内容中找到指定的行。快捷键 L 用于输入要搜索的关键字,& 表示跳转到下一个匹配项。搜索关键字会被高亮,除了使用 & 以外,你也需要使用 PgUp 和 PgDown 等来调整展示的内容。
Searching is different from filtering. The search does not consider the fields, and will try to match the content of a row in the task area. The shortcut key L is used to enter the keyword to be searched, & means to jump to the next matching item. Search keywords will be highlighted. In addition to using &, you also need to use PgUp and PgDown to adjust the displayed content.
其他定制 Other Customization
- R 切换排序的方向,默认是从高到底,可以切换为从低到高。
- x 切换是否高亮显示排序列。
- y 切换是否高亮显示 running 的 task。
- b bold/reverse,这个快捷键用于切换关键位置是粗体展示还是反色展示,会影响到 x, y 的展示效果,也会影响到 summary area 的 CPU 进度条 和 memory 进度条的展示效果。
-
d 定时刷新间隔,默认是 3s。
- R switches the sorting direction. The default is from high to bottom, and it can be switched from low to high.
- x Toggle whether to highlight the sorting column.
- y Toggle whether to highlight the running task.
- b bold/reverse, this shortcut key is used to switch the key position to be displayed in bold or in reverse color, which will affect the display effect of x, y, and also affect the display effect of the CPU progress bar and memory progress bar of the summary area.
- d Regular refresh interval, the default is 3s.
V 切换成森林视图,也就是展示进程父子关系。这个模式下无法按照字段排序。效果如下图: V switches to the forest view, which is to show the parent-child relationship of the process. It is not possible to sort by field in this mode. The effect is as follows:
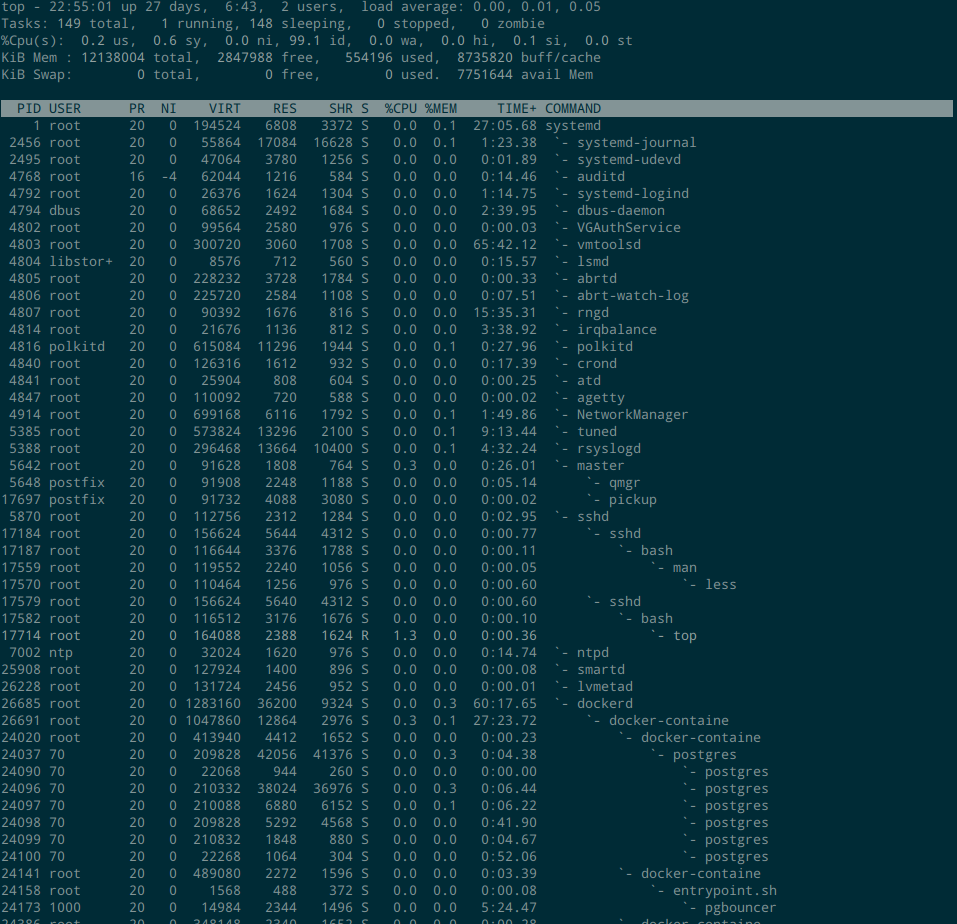
有时候不想看层级太深的任务,可以使用 other filter。除了第二级是一个空格,往下的每一级都是每级三个空格,最后再加上一个反引号开头。所以要过滤掉第三级以下的,可以使用如下条件(COMMAND=后面跟7个空格):
Sometimes you don’t want to look at tasks that are too deep, you can use other filters. Except for the second level, which is a space, each level down is three spaces per level, and a backquote is added at the end. So to filter out those below the third level, you can use the following conditions (COMMAND= followed by 7 spaces):
!COMMAND= `
界面颜色 Color
为了更清晰的进行监控,定制颜色也是很有用的。可以按快捷键 Z 进入颜色定制界面,如下图所示:
In order to monitor more clearly, custom colors are also useful. You can press the shortcut key Z to enter the color customization interface, as shown in the following figure:
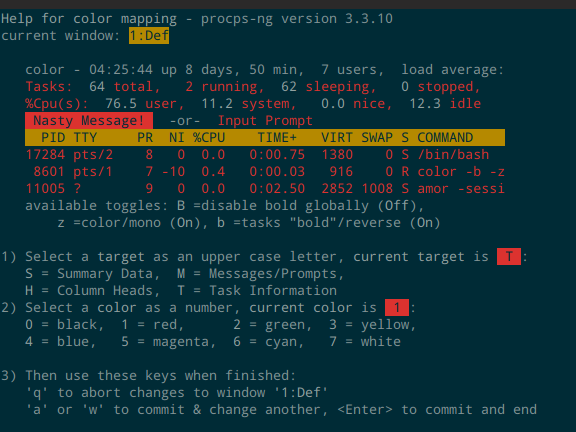
首先可以看到上半部表示了当前正在设置哪个窗口,然后下半部有 1 2 3 三个步骤:
First of all, you can see that the upper part represents which window is currently being set, and then there are three steps in the lower part:
- 选择要定制的区域 Select the area to be customized:
- S: Summary Data
- M: Messages/Prompts
- H: Column Heads
- T: Task Information
- 给选定的区域选择一个颜色,用数字 0 到 7 对应 8 个颜色。Choose a color for the selected area, and use the numbers 0 to 7 to correspond to 8 colors.
- q 取消颜色设置, a 或者 g 提交颜色设置并且切换到下个窗口进行设置,回车提交颜色设置并且退出这个界面。 q Cancel the color setting, a or g to submit the color setting and switch to the next window for setting, press Enter to submit the color setting and exit this interface.
在 top 界面上,可以通过快捷键 z 来切换是否使用颜色。
On the top interface, you can use the shortcut key z to switch whether to use color.
配置文件 Configuration File
上面讲的这些定制,都可以保存到一个配置文件,然后 top 每次启动都会载入它所找到的配置文件。配置文件中会保存一些全局模式,比如 Irix mode 的配置,刷新时间等,也会保存每个窗口的字段配置和颜色配置等,还会保存 inspect entries (见下文)。
These customizations mentioned above can be saved to a configuration file, and then top will load the configuration file it could find when it starts. The configuration file will save some global modes, such as Irix mode configuration, refresh time, etc., field configuration and color configuration of each window, etc., and inspect entries (see below).
生成配置文件的方式很简单,在你完成想要的定制后,按快捷键 W 即可。CentOS 7 上,配置文件的保存路径是 /root/.toprc;Ubuntu 上则是 ~/.config/procps/toprc,每次你保存的时候,top 会显示这个路径。
Generate configuration files is very easy, when you’re done customizing, shortcut keys W can be. On CentOS 7, the storage path of the configuration file is /root/.toprc; on Ubuntu, it is ~/.config/procps/toprc. Each time you save, top will display this path.
Inspect Mode
top 有一个模式,可以允许你执行指定的命令来查看一个任务的更多信息,这个模式可以称为 Inspect Mode,通过快捷键 Y 可以进入这个模式,top 会提示你输入一个要 inspect 的 PID。不过,要使用这个模式,你需要先定义可以使用的 inspect entries,否则 top 不会进入这个模式。下面是一个最简单的配置,可以先体会下这个配置是如何写的:
top has a mode which allows you to execute specified commands to view more information about a task. This mode can be called Inspect Mode. You can enter this mode with the shortcut key Y. Top will prompt you to enter a PID to inspect. However, to use this mode, you need to define the inspect entries that can be used first, otherwise top will not enter this mode. The following is the simplest configuration, you can first experience how this configuration is written:
[root@user ~]# cat .toprc
top's Config File (Linux processes with windows)
Id:i, Mode_altscr=0, Mode_irixps=1, Delay_time=3.0, Curwin=0
Def     fieldscur=ķ&')*+,-./012568<>?ABCFGHIJKLMNOPQRSTUVWXYZ[\]^_`abcdefghij
        winflags=195892, sortindx=18, maxtasks=0, graph_cpus=0, graph_mems=0
        summclr=5, msgsclr=1, headclr=3, taskclr=4
Job     fieldscur=(Ļ@<)*+,-./012568>?ABCFGHIJKLMNOPQRSTUVWXYZ[\]^_`abcdefghij
        winflags=193844, sortindx=0, maxtasks=0, graph_cpus=0, graph_mems=0
        summclr=6, msgsclr=6, headclr=7, taskclr=6
Mem     fieldscur=<MBND34&'()*+,-./0125689FGHIJKLOPQRSTUVWXYZ[\]^_`abcdefghij
        winflags=193844, sortindx=21, maxtasks=0, graph_cpus=0, graph_mems=0
        summclr=5, msgsclr=5, headclr=4, taskclr=5
Usr     fieldscur=)+,-./1234568;<=>?@ABCFGHIJKLMNOPQRSTUVWXYZ[\]^_`abcdefghij
        winflags=193844, sortindx=3, maxtasks=0, graph_cpus=0, graph_mems=0
        summclr=3, msgsclr=3, headclr=2, taskclr=3
Fixed_widest=0, Summ_mscale=0, Task_mscale=0, Zero_suppress=0

pipe    Open Files      lsof -P -p %d 2>&1
上面的最后一行就是就是一个 inspect entry,表示获取进程打开的文件列表。使用这个配置文件后,打开 top,按 Y 进入 inspect 模式,效果如下:
The last line above is an inspect entry, which means to get the list of files opened by the process. After using this configuration file, open top and press Y to enter inspect mode. The effect is as follows:
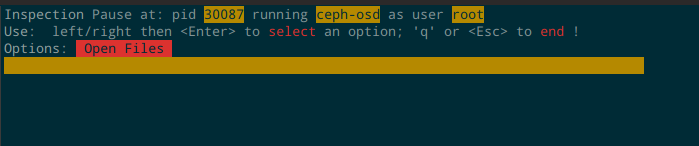
在这个界面,可以左右选择你自定义的 entry,然后回车就可以执行。比如上面这个 Open Files 执行后的效果如下,和直接使用 lsof 命令的效果一样:
In this interface, you can select your customized entry using left and right, and then press Enter to execute it. For example, the effect of the execution of the above Open Files is as follows, which is the same as the effect of directly using the lsof command:
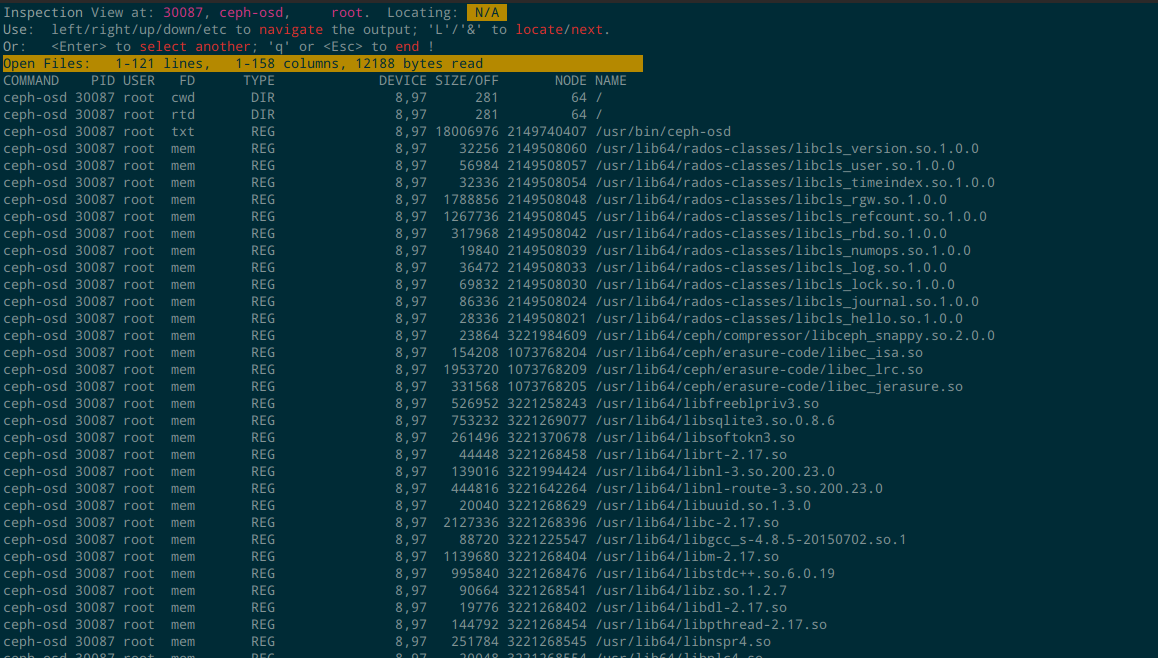
在上面这个界面,可以使用 PgUp, PgDown, Home, End 等进行滚动,也可以使用 less 命令的语法( / 表示搜索)。
In the above interface, you can use PgUp, PgDown, Home, End to scroll, or you can use the syntax of the less command ( / meaning search).
下面来看 entry 的定制语法。
Let’s look at the custom syntax of entry.
首先,# 开头的行是被注释掉的。
First of all, the line beginning with # is commented out.
一行 inspect entry 包含三个部分: type, name, fmts,每个部分之间使用制表符 \t 分隔。
- type: 可以是 file 或者 pipe。file 就是打开一个文件,读它的内容。pipe 就是用
popen接口执行命令,然后获取输出。 - name: 名字,比如你上面看到的 Open Files。
- fmts:一个文件路径,或者一行命令。这个部分可以使用变量
%d表示 PID,比如/proc/%d/numa_maps或者lsof -P -p %d 2>&1。
One inspect entry consists of three parts: type, name, fmts, using the tab portions between each \t parts.
- type : Can be file or pipe. file is to open a file and read its contents. pipe is to use the popen interface to execute commands, and then get the output.
- name : The name, such as the Open Files you saw above .
- fmts : A file path, or a line of commands. This section can use variables
%drepresent PID, such as/proc/%d/numa_mapsorlsof -P -p %d 2>&1.
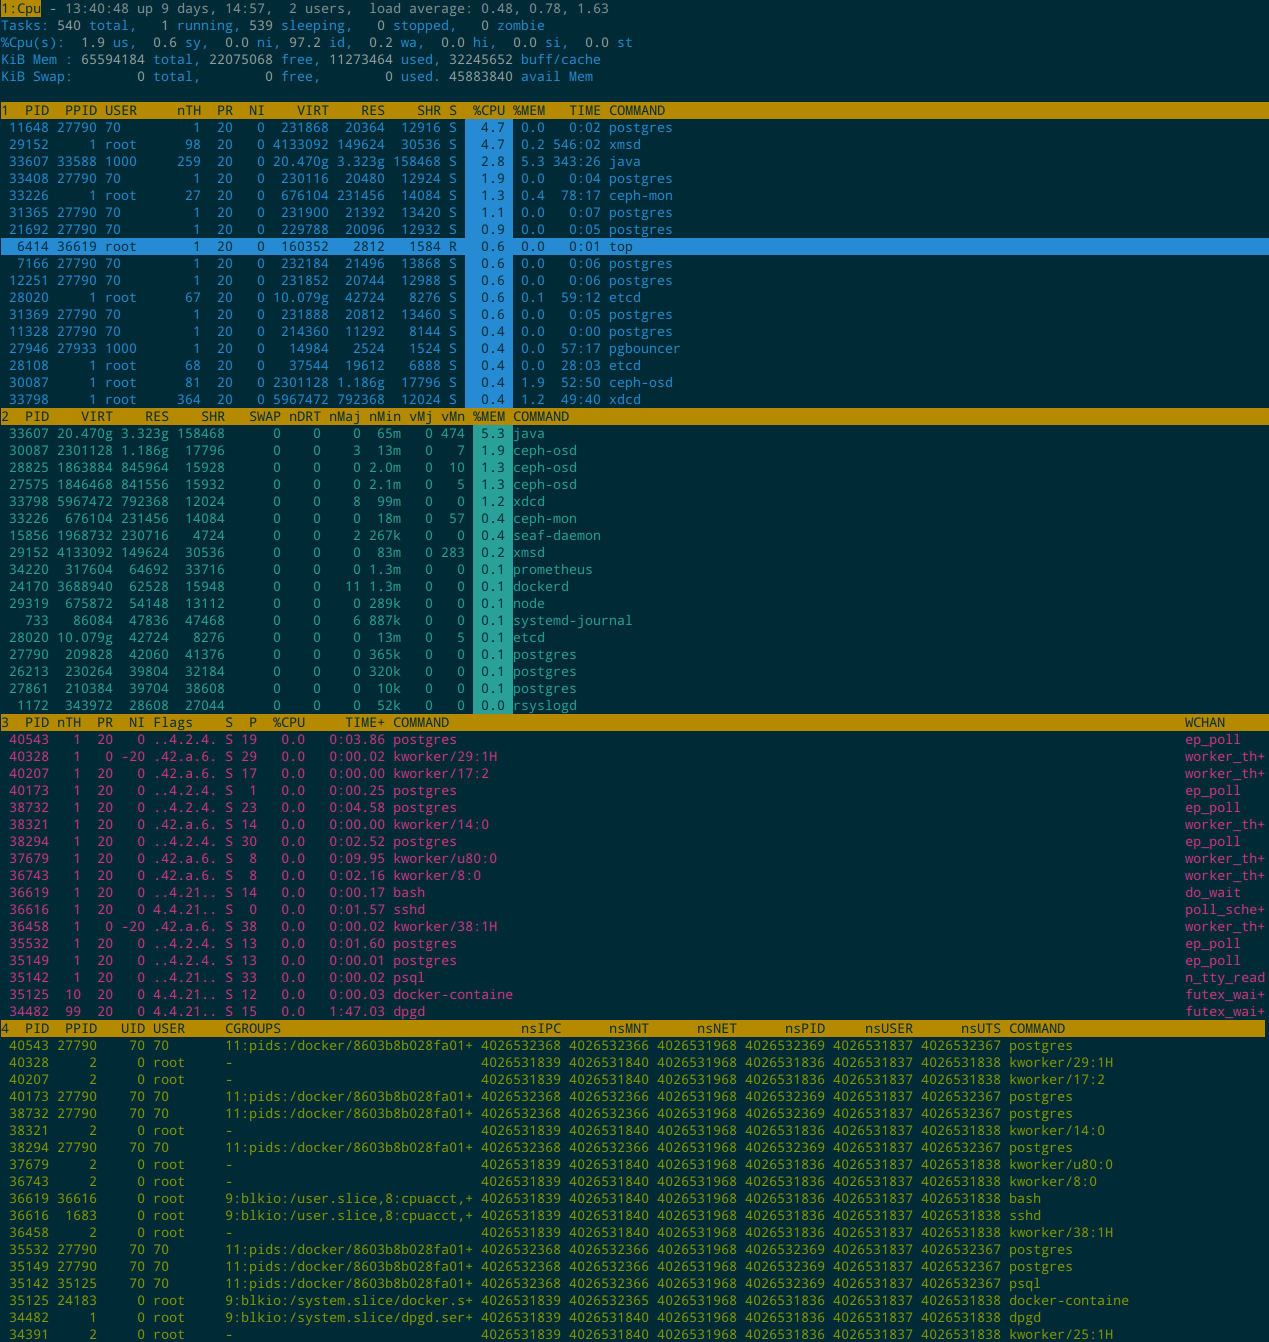
我的定制 My Customization
效果如下:
The effect is as follows:
我在 CentOS 7 下的定制文件如下:
My customized files under CentOS 7 are as follows:
top's Config File (Linux processes with windows)
Id:i, Mode_altscr=0, Mode_irixps=1, Delay_time=3.0, Curwin=0
Cpu     fieldscur=ķ9')*+,-./0126<>?ABCFGHIJKLMNOPQRSTUVWXYZ[\]^_`abcdefghij
        winflags=195380, sortindx=18, maxtasks=0, graph_cpus=0, graph_mems=0
        summclr=4, msgsclr=1, headclr=3, taskclr=4
Mem     fieldscur=&97(34D')*+,-./012568>?FGHIJKLOPQRSTUVWXYZ[\]^_`abcdefghij
        winflags=195380, sortindx=21, maxtasks=0, graph_cpus=0, graph_mems=0
        summclr=6, msgsclr=6, headclr=3, taskclr=6
Sch     fieldscur=:;<=>?@AMBNC&'()*+,-./0128HIJKLOPQRSTUVWXYZ[\]^_`abcdefghij
        winflags=194868, sortindx=0, maxtasks=0, graph_cpus=0, graph_mems=0
        summclr=5, msgsclr=5, headclr=3, taskclr=5
Cgp     fieldscur=*097:D)+,-./1234568;<=>?@ABCFGIJKLMNOVWXYZ[\]^_`abcdefghij
        winflags=194868, sortindx=0, maxtasks=0, graph_cpus=0, graph_mems=0
        summclr=2, msgsclr=3, headclr=3, taskclr=2
Fixed_widest=0, Summ_mscale=0, Task_mscale=0, Zero_suppress=0

pipe    NetFiles        lsof -a -l -n -P -i4 -p %d 2>&1
pipe    OpenFiles       lsof -a -l -n -P -p %d 2>&1
file    NUMAInfo        /proc/%d/numa_maps
主要是定制了 4 个 window 的字段和颜色,还有 3 个 inspect entries:
Mainly customize the fields and colors of 4 windows, and 3 inspect entries:
- CPU (sort by %CPU): PID, PPID, USER, PR, NI, VIRT, RES, SHR, S, %CPU, %MEM, TIME+, COMMAND
- Mem (sort by %MEM): PID, VIRT, RES, SHR, SWAP, nDRT, nMaj, nMin, vMj, vMn, %MEM, COMMAND
- Sche (sort by PID): PID, nTH, PR, NI, Flags, S, P, %CPU, TIME+, COMMAND, WCHAN
- CGROUP (sort by PID): PID, PPID,UID, USER, CGROUPS, nsIPC, nsMNT, nsNET, nsPID, nsUSER, nsUTS, COMMAND
如果要直接使用的话,用 base64 解码下面的内容,直接从网页上拷贝会有字符问题:
If you want to use it directly, use base64 to decode the following content, and directly copy from the web page has character problems:
dG9wJ3MgQ29uZmlnIEZpbGUgKExpbnV4IHByb2Nlc3NlcyB3aXRoIHdpbmRvd3MpCklkOmksIE1v
ZGVfYWx0c2NyPTAsIE1vZGVfaXJpeHBzPTEsIERlbGF5X3RpbWU9My4wLCBDdXJ3aW49MApDcHUJ
ZmllbGRzY3VyPaWmqLWztLu9wMS3urg5xScpKissLS4vMDEyNjw+P0FCQ0ZHSElKS0xNTk9QUVJT
VFVWV1hZWltcXV5fYGFiY2RlZmdoaWoKCXdpbmZsYWdzPTE5NTM4MCwgc29ydGluZHg9MTgsIG1h
eHRhc2tzPTAsIGdyYXBoX2NwdXM9MCwgZ3JhcGhfbWVtcz0wCglzdW1tY2xyPTQsIG1zZ3NjbHI9
MSwgaGVhZGNscj0zLCB0YXNrY2xyPTQKTWVtCWZpZWxkc2N1cj2lu73AvMPBws3OJjk3uigzNEQn
xSkqKywtLi8wMTI1Njg+P0ZHSElKS0xPUFFSU1RVVldYWVpbXF1eX2BhYmNkZWZnaGlqCgl3aW5m
bGFncz0xOTUzODAsIHNvcnRpbmR4PTIxLCBtYXh0YXNrcz0wLCBncmFwaF9jcHVzPTAsIGdyYXBo
X21lbXM9MAoJc3VtbWNscj02LCBtc2dzY2xyPTYsIGhlYWRjbHI9MywgdGFza2Nscj02ClNjaAlm
aWVsZHNjdXI9pTo7PD0+P0BBTUJOQ7WztMfEtre5xcYmJygpKissLS4vMDEyOEhJSktMT1BRUlNU
VVZXWFlaW1xdXl9gYWJjZGVmZ2hpagoJd2luZmxhZ3M9MTk0ODY4LCBzb3J0aW5keD0wLCBtYXh0
YXNrcz0wLCBncmFwaF9jcHVzPTAsIGdyYXBoX21lbXM9MAoJc3VtbWNscj01LCBtc2dzY2xyPTUs
IGhlYWRjbHI9MywgdGFza2Nscj01CkNncAlmaWVsZHNjdXI9paanqCowOTc6RCkrLC0uLzEyMzQ1
Njg7PD0+P0BBQkNGR8hJSktMTU5P0NHS09TVxVZXWFlaW1xdXl9gYWJjZGVmZ2hpagoJd2luZmxh
Z3M9MTk0ODY4LCBzb3J0aW5keD0wLCBtYXh0YXNrcz0wLCBncmFwaF9jcHVzPTAsIGdyYXBoX21l
bXM9MAoJc3VtbWNscj0yLCBtc2dzY2xyPTMsIGhlYWRjbHI9MywgdGFza2Nscj0yCkZpeGVkX3dp
ZGVzdD0wLCBTdW1tX21zY2FsZT0wLCBUYXNrX21zY2FsZT0wLCBaZXJvX3N1cHByZXNzPTAKCnBp
cGUJTmV0RmlsZXMJbHNvZiAtYSAtbCAtbiAtUCAtaTQgLXAgJWQgMj4mMQpwaXBlCU9wZW5GaWxl
cwlsc29mIC1hIC1sIC1uIC1QIC1wICVkIDI+JjEKZmlsZQlOVU1BSW5mbwkvcHJvYy8lZC9udW1h
X21hcHMK
Updates
- 2021/6/11: Translate From Chinese to English with Google translate, then checking and editing. Cost me 1.5 hour.
 本作品采用知识共享署名-非商业性使用-禁止演绎 4.0 国际许可协议进行许可。